Optiscan 2D Viewer
The Optiscan 2D Viewer is used as the main screen to edit object masks and to display the resulting fields during a simulation.
The Plot Area
The Plot Area shows the mask which is selected in the “Mask Selector.”
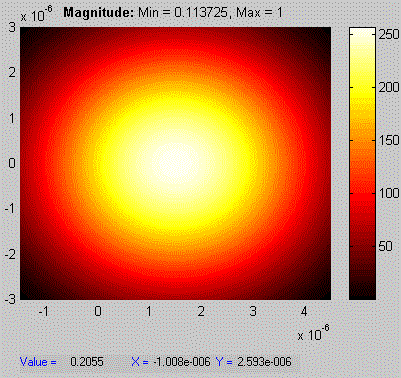
The title of the plot describes the type of processing that was applied to the raw data. The following types of processing are available:
Processing Description | Applied MATLAB Operation
- Magnitude | abs(data)
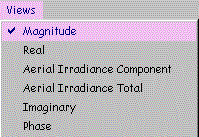
- Real | real(data)
- Aerial Irradiance Component
- Aerial Irradiance Total –
- Imaginary | imag(data)
- Phase | angle(data)
The title of the plot displays both the maximum and the minimum value displayed. The Color Bar to the left of the plot shows the association between color and the value of individual plot points. The top of the Color Bar is mapped to the maximum value and the bottom of the Color Bar is mapped to the minimum value.
ColorMap Menu – The ColorMap menu allows you to change the colormap of the plot. The default colormap is ‘hot’
Available Colormaps:
- ‘gray’ linear grayscale colormap.
- ‘hot’ varies smoothly from black, through shades of red, orange, and yellow, to white.
- ‘hsv’ varies the hue component of the hue-saturation-value color model. The colors begin with red, pass through yellow, green, cyan, blue,
- ‘jet’ ranges from blue to red, and passes through the colors cyan, yellow, and orange. It is a variation of the hsv colormap. The jet colormap is associated with an astrophysical fluid jet simulation from the National Center for Supercomputer Applications.
Point Value Area – As the mouse moves over the plot, the value of the plot point under the mouse cursor is displayed in the Point Value Area:
![]()
The Point Value Area is disabled when Zoom is on.
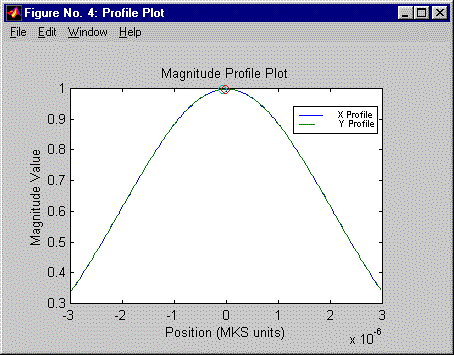
Profile Plots – Click on the plot to display a “Profile Plot.”
An X/Y Profile Plot is displayed when the mouse is clicked on the plot. The Profile Plot below shows the Gaussian distribution of the plot shown above.
The X/Y Profile Plot feature is disabled while Zoom is on.
Selecting A Plot:
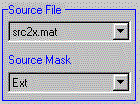
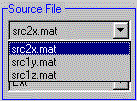
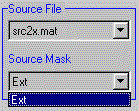
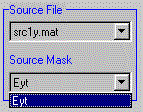
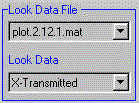
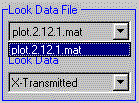
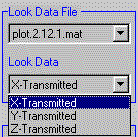
The Plot Selection Area can be used to select which plot should be shown. The “top” listbox in (A) contains the name of the plot file. The “top” listbox is shown in more detail in (B). The “bottom” listbox in (A) contains the plots which can be viewed. The “bottom” listbox is show in more detail in (C).
- (A)
- (B)
- (C)
- (C)
- (A.2)
- (B.2)
- (C.2)
Menu Items Control:
The Menu Items portion of the Optiscan 2D Viewer allows you to work with the Optiscan Object that is associated with the displayed images:

The following is a sample menu:
- Properties – Displays the associated object’s properties and lets the user edit them.
- Replace A Piece – Allows the displayed image to be partly or totally replaced by another image.
- Multiply A Piece – Allows the displayed image to be partly or totally multiplied by another image.
- Add a Piece – Allows another image to be partly or totally added to the displayed image.
- Save Layer As – Allows the current layer to be saved into a new file
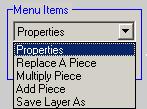
When the Go Button is clicked, then the selected item in the Menu Items is performed.
The Zoom/Pan Control :

The Zoom/Pan Control can be used to translate the plot left and right and to zoom in to see more detail.
By clicking on the arrows, the plot will be translated in the direction shown by the arrow.
By clicking on the “M”, the following menu will be displayed:
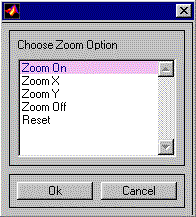
Zoom Option & Description
- Zoom On – When the plot is clicked on, the magnification factor is increased.
- Zoom X – Only zoom the X axis.
- Zoom Y – Only zoom the Y axis.
- Zoom Out – When the plot is clicked on, the magnification factor is decreased.
- Reset – The default magnification is restored.


