Lens View Editor
The Lens View Editor allows the user to see their lens, plotted graphically. It also allows the user to change the parameters which are associated with the lens.
The Plot Area:
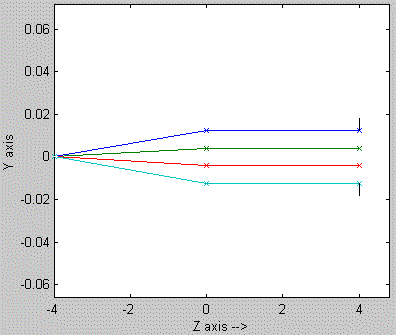
The Plot Area shows what the lens system looks like:

The Zoom Control can be used to magnify and pan the plot. The stop, entrance pupil and exit pupil are displayed on the plot. A small number of geometrical rays indicate the light path through the system.
The Lens View Menu:
The Lens Viewer has several menu items that allows you to change the properties of your lens and the properties of the lens viewers:

Properties – This lets you modify the properties of the lens object
- Setup – Use to change the lens prescription file (more)
- Propagation – Propagation calculation options. (more)
- Aberration – Add lens aberrations (more)
- Illuminator – Specify an illuminating lens. (more)
- Sampling – Specify sampling. (more)
Lens Editor – This lets you edit your lens.
- Lens Settings – Change Stop Surface, Stop Diameter, LAMBDA. (more)
- Lens Editor – Modify the parameters that are associated with each surface of the current lens. (the one which is being viewed) (more)
Viewer Settings – This allows you to modify the Lens Viewer’s settings.
- Viewer Settings – Change the settings of the Lens Viewer (more)
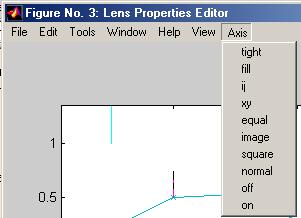
The Axis Menu:

- tight sets the aspect ratio so that the data units are the same in every direction. This differs from axis equal because the plot box aspect ratio automatically adjusts.
- fill sets the axis limits to the range of the data.
- ij places the coordinate system origin in the upper-left corner. The i-axis is vertical, with values increasing from top to bottom. The j-axis is horizontal with values increasing from left to right.
- xy draws the graph in the default Cartesian axes format with the coordinate system origin in the lower-left corner. The x-axis is horizontal with values increasing from left to right. The y-axis is vertical with values increasing from bottom to top.
- equal sets the aspect ratio so that the data units are the same in every direction. The aspect ratio of the x-, y-, and z-axis is adjusted automatically according to the range of data units in the x, y, and z directions.
- image is the same as axis equal except that the plot box fits tightly around the data.
- square makes the current axes region square (or cubed when three-dimensional). MATLAB adjusts the x-axis, y-axis, and z-axis so that they have equal lengths and adjusts the increments between data units accordingly.
- normal automatically adjusts the aspect ratio of the axes and the aspect ratio of the data units represented on the axes to fill the plot box.
- off turns off all axis lines, tick marks, and labels.
- on turns on all axis lines, tick marks, and labels.
(Descriptions of axis settings were taken from the Matlab help documentation)
See also:
- Aberrations Panel
- Auxiliary Command Line Functions (PDF)
- Lens Functions (Tutorial 4: Querying Spot System)
- Lens Tilts (Tutorial 6: Lens Tilts)
- Lens Editor Panel
- Lens Properties Panel
- Lens Sampling Panel
- Lens Setup Panel
- Lens View Editor
- Lens Viewer Settings

