Field Map Generator
Calculates and plots the time average of amplitude and phase of an XFDTD simulation and saves this data
Input:
- leader label: name of XFDTD simulation
- section label: observation plane of steady state data
- initial file: beginning time step of steady state data
- last file: end time step of data
- skip: time increment of steps
- number of rows: number of cells in x direction for xy and xz planes
- number of cells in y direction for yz plane
- number of columns: number of cells in y direction for xy plane
- number of cells in z direction for xz and yz
- frequency: frequency of voltage source
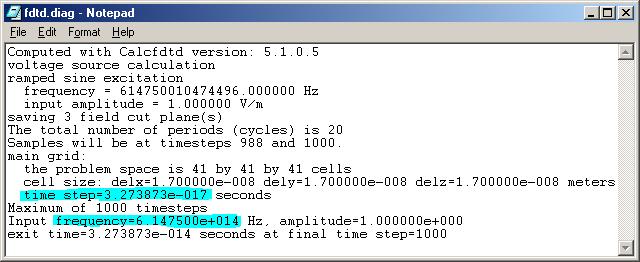
- time_step: calculated by xfdtd (lookup in fdtd.diag)
- load_path: full path of the converted data
- save directory: where you want to save the amplitude and phase profile of the converted data for x, y, and z components of the voltage source
Buttons:
- Save as Default: Saves the current input values so you don’t have to re-input them the next time you use this panel
- Calculate: Runs the calculation program
Example:
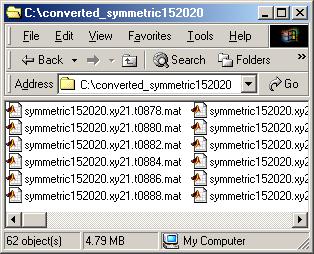
This is the directory where the output from the Convert XFDTD to Optiscan calculator is stored
This is what I input into the panel
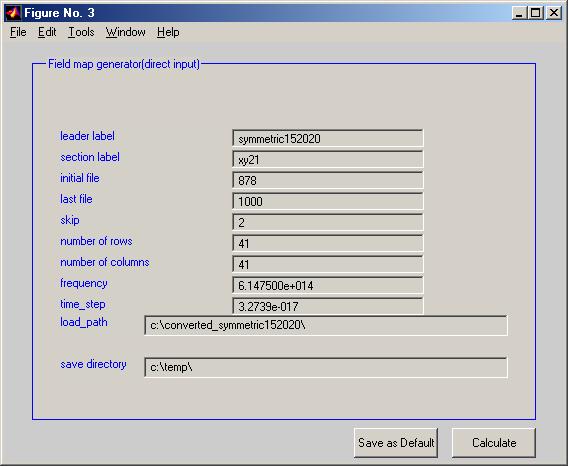
- leader label is “symmetric152020”
- section label: xy plane at z=21
- my first time step is 878 and my ending time step is 1000
- the skip is 2
- I have 41 rows and 41 columns in my simulation
- frequency and time step I copied from the xfdtd.diag file that is automatically saved into the directory with my xfdtd simulation data (see below)
- the output from the Convert XFDTD to Optiscan calculator is stored in c:\converted_symmetric152020\
- I want the output saved in “c:\temp\” (note the ending slash)
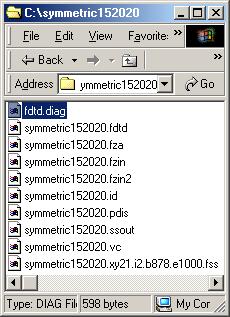
This is where my XFDTD simulation output is stored (notice the fdtd.diag file) :
This is the contents of the fdtd.diag file:
Output:
- file: the time averaged complex amplitude and phase values are saved in a matlab file that has a name that is made up of the name of the simulation and the section label with an extension of “.mat”
- plot: plot of the period of the wave
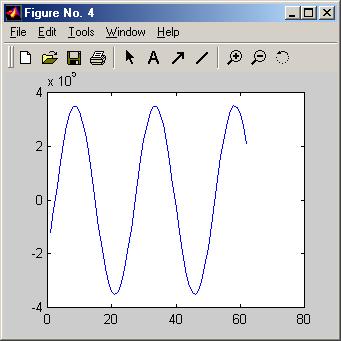
- field profile of amplitude and phase


