Interpreting the Results
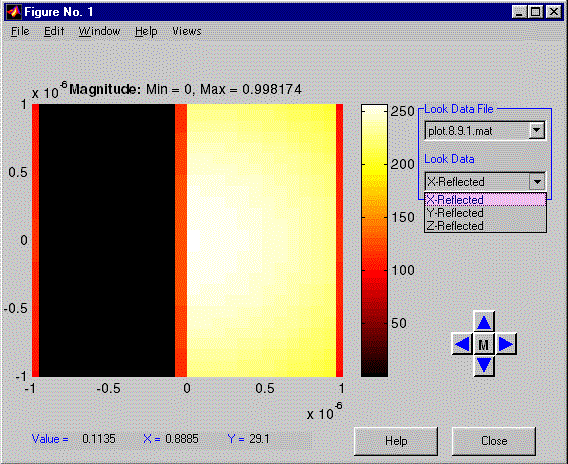
1. The simulation should display four plot windows similar to :

2. simulation interpretation
- Plot 1
- Plot 2
- Plot 3
- Plot 4
The output shows the gaussian beam scanning across the diffraction grating.
3. Advanced Plot Information:
The red bars are articfacts of the interpolation routine since the source and the target use only 100×100 samples each. A finer sampling would reduce these artifacts but increase both the simulation time and the memory requirements.
In this simulation, only the x-component of the transmitted field was used. If the source had a non-zero y-component or z-component, then you could look at those components by choosing the y-reflected or z-reflected items.
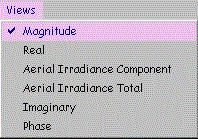
You may use the view menu to preform various kinds of computations on the fields:

Additionally information about the plot window can be found by clicking the “Help” button.


