

Dual Comb Spectroscopy
Introduction
Dual comb spectroscopy (DCS) can achieve high spectral resolution and short acquisition time (compared to Fourier-transform spectroscopy) simultaneously since no moving parts are required. Traditional DCS uses phase locking to connect two femtosecond lasers, which requires complex electronics. Our designs address these issues by using a single laser cavity to generate both the probe and the local oscillator. We have made several variations since our original publication, broadening the useful spectral range, and shifting the wavelength in order to cover key H20 and CO2 absorption lines.
Students: Yi-Shin Ou, Joshua Olsen
Recent Projects:
We demonstrated a Thulium fiber based DCS system. This shifted our wavelength into the 2 micron range, and demonstrated single-shot DCS of H20 absorption lines.
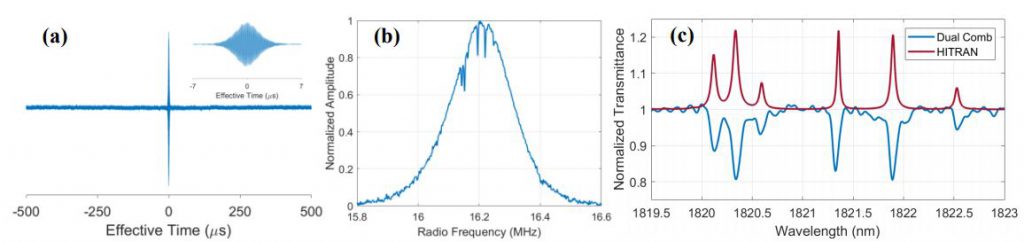
(a) Single-shot time-domain interferogram captured over 1 ms. Inset: Center-burst of the interferogram. (b) Recovered spectral magnitude from the single-shot time-domain interferogram (linear scale). (c) Water vapor absorption lines from the DCS measurement compared to HITRAN data
We demonstrated an octave-spanning laser source for dual-comb spectroscopy. Two optical frequency combs (OFCs) were generated from a single laser cavity and frequency broadened to cover over an octave for broadband single shot DCS.
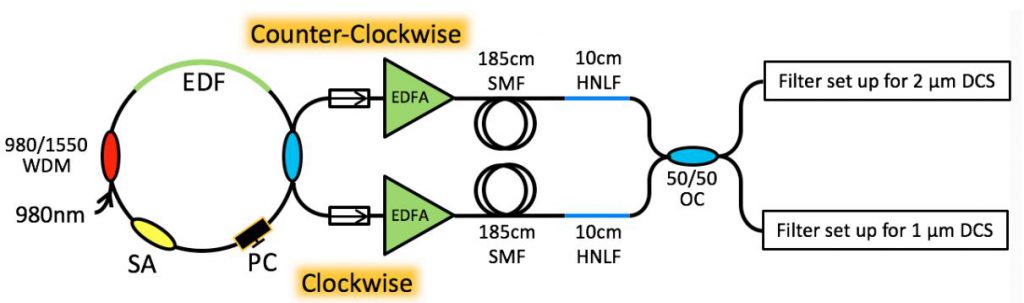
A schematic diagram of the laser system
We presented a simple and robust dual-comb system that uses a free-running bidirectionally mode-locked fiber laser operating at telecommunication wavelength. Two femtosecond frequency combs (with a small difference in repetition rates) were generated from a single laser cavity to ensure mutual coherent properties and common noise cancellation. As a result, we achieved real-time absorption spectroscopy measurements without the need for complex servo locking with accurate frequency referencing, and relatively high signal-to-noise ratio. We used this laser to match to the NIST data for HCN gas, and found a close match in our results.
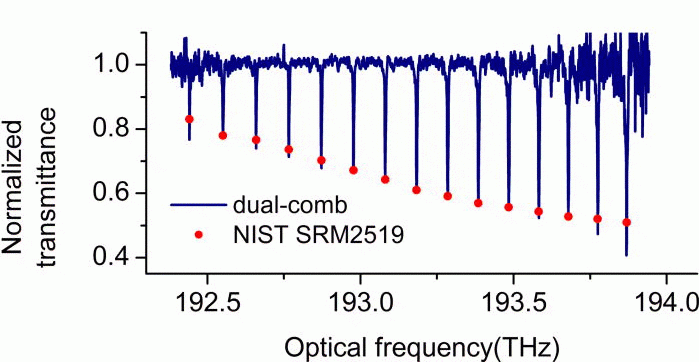
15 absorption lines of HCN gas are shown. The absorption lines central frequencies deviate from the NIST SRM2519 database with ∼207 MHz standard deviation