
Solar Radiometer
Langley Method | Aerosol and Ozone Retrieval | Columnar Water Vapor Retrieval
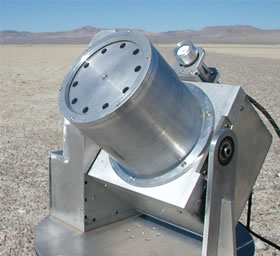
Automated Solar Radiometer (ASR)
The Remote Sensing Group has two 10-channel, fully automated solar radiometers built by 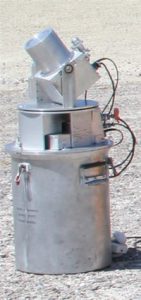 the Atmospheric Remote Sensing Laboratory under the supervision of Dr. John Reagan of the Electrical and Computer Engineering Department at the University of Arizona.
Solar radiometry uses measurements of the sun’s energy at the surface of the earth to determine either the absolute output of the sun or to infer properties of the earth’s atmosphere. Some of the information we can obtain includes the amount of aerosols (or dust particles), total amount of ozone and water vapor, and the sizes of aerosols. The primary use of solar radiometer data by the Remote Sensing Group is to characterize the atmosphere for use in the vicarious calibrations and atmospheric corrections done by the group.
For vicarious calibration, solar radiometer data are collected around the time of a satellite overpass. These data are first processed to retrieve total optical thickness (related to total amount of absorbers and scatterers along the solar path). The total optical thicknesses are used in an inversion scheme to estimate the aerosol size distribution and columnar amounts of ozone and water vapor. All of these results are used as input to a radiative transfer code to predict the radiance at the top of the atmosphere used in the vicarious calibration.
 An identical procedure is followed for the atmospheric correction except the radiances at the top of the atmosphere are predicted for several values of surface reflectance. This table of reflectance versus radiance is then used in the atmospheric correction to predict the surface reflectance.
Langley Method
The Langley method is named for Samuel P. Langley of the Smithsonian Institute and is based on his work of the early 1900s to determine the solar constant (total amount of incoming solar energy at the top of the earth’s atmosphere over a unit area). Langley realized that the attenuation of the solar energy depends linearly on the total amount of attenuators along the path. That is, if one doubles the amount of air molecules along the path of the solar beam, one halves the amount of solar energy that can reach the surface. A critical concept to realize is that the transmitted solar energy can also decrease if the number of scatterers is constant, but the path length changes.
It is this path length dependence that is used in the Langley method. Measurements are made at the earth’s surface of the transmitted solar energy for a period shortly after sunrise or shortly before sunset. Since the solar position is changing with time, the solar path is also changing. If one assumes the atmosphere does not change with time, one should be able to extrapolate the measurements of solar energy taken at several path lengths to infer what the solar energy would be if the path length were zero. The data collected as a function of time can be represented on a Langley plot.
An example Langley plot is shown in the figure below. In this figure, airmass is introduced for the x-axis label. Airmass is directly related to path length. Thus an airmass of two is related to a path length which is twice as long as an airmass of one. For most cases, airmass can be computed as the secant of the solar zenith angle (1/cos). The zenith angle is 90° when the sun is on the horizon and 0° when the sun directly above. Thus, it can be seen that the smallest airmass possible is unity. One can compute the airmass by using the time of the measurement to determine the solar zenith angle.
The y-axis is the natural logarithm of the voltage output of the solar radiometer. Voltage is used because this is the actual output of the solar radiometer and one assumes this output is linearly related to the solar irradiance on the radiometer. We use the natural logarithm because we assume the attenuation follows Beer’s Law:
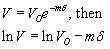
Physically, Beer’s law tells us that the logarithm of the radiometer’s output is directly related to the path length.
There are two sets of data on the graph representing two different wavelength regions. In both cases, the solid line through the points indicates the best fit to the data. The slope of this line is related to the optical thickness of the atmosphere. The point at which the line intersects the y-axis is the value the instrument would report if there were no atmosphere. If an absolute calibration for the solar radiometer is known, this exoatmospheric voltage can be converted to an incident solar irradiance.
It is clear from the graph that the two data sets shown have different slopes. Since the slopes are related to optical thickness, it can be inferred that the optical thickness for the shorter wavelength data is larger then that for the longer wavelength. This wavelength dependence is used to determine information about the sizes of the aerosol particles in the atmosphere.
For the work of the Remote Sensing Group, we are mostly interested in computing the intercept of these data. Once the intercept is known, it is possible to compute the the optical thickness of the atmosphere using Beer’s Law. These optical thicknesses are used in the inversion described in a later section to determine the aerosol properties.
The most critical assumption we make in the Langley method is assuming the atmosphere does not change over the entire period of the data set used to determine the intercept. The figure below shows a Langley plot for which the atmosphere was not constant for the measurement period. As seen, there are large deviations of the individual data points from the best fit line. This has two impacts. The first is the retrieved intercept will be in error. The second is the optical thickness will be wrong. Typical causes of these varying atmospheric conditions are clouds, convection, and high winds. Volcanic clouds in the stratosphere have also caused difficulties.
Because one would like to know the optical thickness as a function of time, the primary goal of the Langley method is to determine intercepts for each band of the solar radiometer. To do this one collects Langley plot data for several days. One then selects the days for which the atmosphere appears not to change during the measurement periods and average the intercepts for these days.
Aerosol and Ozone Retrieval
One can determine information about the size of the atmospheric aerosols by examining how the optical depths change as a function wavelength. This is done by assuming the aerosols are spherically-shaped and scatter according to Mie theory. This assumption greatly simplifies the problem.
In the method currently used by the Remote Sensing Group, we also assume that the aerosols follow a Junge, or power law, size distribution. This is not necessary to solve the problem but again simplifies the solution, and the assumption is typically a good one for most cases observed by our group.
When the Junge assumption is used, the spectral optical depth as a function of wavelength is linear in log-log space. That is, the logarithm of the optical depth.
Columnar Water Vapor Retrieval
Water vapor can not be determined as easily as aerosols and ozone for two reasons. The first of these is that the amount of absorption by water vapor is not linear with the amount of the gas. That is, if we double the amount of water vapor, we do not double the absorption. This is because many of the absorption lines are saturated to the point where all of the energy is absorbed. Thus adding more water vapor can not increase the absorption. The second reason we must change our approach when dealing with water vapor is that the absorption varies strongly with wavelength. In this case, we must now account for the spectral width and shape of the transmittance profile of the interference filters used.
The current water vapor retrieval approach by the Remote Sensing Group uses three bands in the near-infrared, 870, 940 and 1030 nm. The band at 940 nm falls within a strong water vapor absorption feature, while the data collected in the bands at 870 and 1030 nm are essentially independent of water vapor amount. We use both of our 10-channel automated solar radiometers which were built by John Reagan’s lab for these tasks.
The data in the 940-nm band are corrected for molecular scattering by assuming the molecular scattering can be approximated by Rayleigh scattering and using the atmospheric pressure and center wavelength of the filter. The data are then corrected for aerosol scattering using the aerosol optical depths at 870 and 1030 nm and assuming Angstrom’s turbidity law is valid. The result of these corrections is a measurement in the 940-nm band, which in theory is only due to water vapor absorption.
These data are used in modified Langley approach to determine the calibration of the solar radiometer. The modified Langley approach differs from the Langley approach in that it uses the square root of the airmass instead of the airmass. This accounts for the nonlinear dependency of absorption on absorber amount. We also include a slight offset to the data determined from water vapor absorption models. This offset is due to the fact that at very small water vapor amounts (equivalent to a very small airmass), the absorption becomes linear in absorber amount.
Once the radiometer calibration is determined, one can compute the water vapor transmittance for an individual measurement. This transmittance is converted to columnar water vapor using a random band model developed by L. W. Thomason while a student in the Atmospheric Sciences Department at the University of Arizona. The model uses information about the 940-nm filter to determine what the transmittance should be for a given set of atmospheric conditions and water vapor amount. Thus, given transmittance, one can work backwards to determine the columnar water amount.